Immerse Spherical and Hyperbolic Geometry in Euclidean Space Using Gradient Descent
Definition of Geometry
Geometry can be seen as a set of points and a distance function between each two points that satisfies the metric space (positive, symmetry, triangle inequality) properties.
Once we have that, we obtain a well defined definition of a line between two points, which is a set of points, containing the shortest path between the two points (think of Dijkstra, a shortest path in a graph).
We can then also extend a line, since if you have a line between A and B, you can scan all other points in the set, and take a point C, for which the line AC contains the set of points AB.
The fact that there are 0,1,2+ parallels lines that go through an external point to a line, is also determined by the distance function. Circles and angles are also the result of the distance function.
Coordinates
At times, it’s possible to establish a coordinate system, which can be quite advantageous. This allows for the assignment of names to points within the set, which proves particularly handy when dealing with infinite sets. Another benefit is the capability to interpolate between two neighboring points to any desired extent.
There are various methods to establish a coordinate system for a given geometry or model. Occasionally, these coordinate systems may impose limitations on the valid values they can accept. Consequently, not every combination of coordinate values may be considered valid.
Metric Differential
Once there is a coordinate system, instead of a distance function that takes two points and outputs a distance, we can have a metric differential.
Some examples of 2D spaces, models and metric differentials:
In the euclidean coordinates: $x,y\in \mathbb{R} \quad ds^2 = dx^2+dy^2 $
Spherical geometries, with spherical coordindates of a sphere with radius of 1, with polar coordinates: $\theta \in [0,\pi], \phi \in [0,2\pi] \quad ds^2 = d\theta^2+sin^2\theta d\phi ^2$
Hyperbolic geometry, with Poincaré half-plane model coordinates $x,y\in \mathbb{R}, y>0 \quad ds^2 = \frac{dx^2+dy^2}{y^2}$
How can we visualize a set of points and a distance differential
So how can we visualize a geometry? Since the distance function is the core of the geometry, we would like to actually place the points in the only space our eyes can look at, which is the Euclidean space, in such a way that the distance between two points in the euclidean space we look at with our eyes, is identical as much as possible, to the real distance, as defined by the distance differential of the geometry we would like to visualize.
So let’s take for example the spherical geometry, which is defined by a coordinate system of two angles $\theta,\phi$ (and a fixed radius).
Then we can create a number of points, and assign each a different $(\theta,\phi)$ position, then place the points in an initial places along the x-y plane (in 2D space), and move the points around until every distance between a pair of points will be the same as the spherical distance.
But hold on, it feels like there’s a problem here: if we map $\phi=0 \rightarrow y=0$ and $\phi=2\pi \rightarrow y=1$, how can we make sure that $y=0$ point is right next to the $y=1$ point? In fact, they are the same point, as $\phi$ is cyclic. So, what we can do, is to add an additional euclidean dimension. Maybe this dimension will help us visualize the distances better. Let’s see.
So, how do we move the 2D points around, in a 3D space? Let’s place them first as a 2D grid, and define a loss function which we will optimize using gradient descent. What loss function should we define? Let’s look at every pair of points, calculate the true (desired) distance using the distance differential of the spherical geometry, and check the difference to the current euclidean distance we visualize, and calculate the squared error. Okay, sounds reasonable. So if we have 10x10 point grid, meaning 100 points, we shall have a 100x100 matrix of pair-losses, which we can sum, and optimize towards zero.
Now, how can we calculate the actual distance between each point pair? After all, we only have the differential, that should be valid for a small region around a point, let’s say between a point to its adjacent neighbour. So, we can model the points as a graph of vertices, place edges between neighbours together with the calculation of the distance differential, and then we can find the shortest path between each two points, using Dijkstra. But, as we remember, this will take us $V^3logV$, and we can do better using Floyd–Warshall in $V^3$. So now we have the real (spherical) distance between each point-pair. The euclean distance for each pair is easy to calculate, and we’re good to go. If you want the code, reach out to me
Let’s run the code for spherical geometry
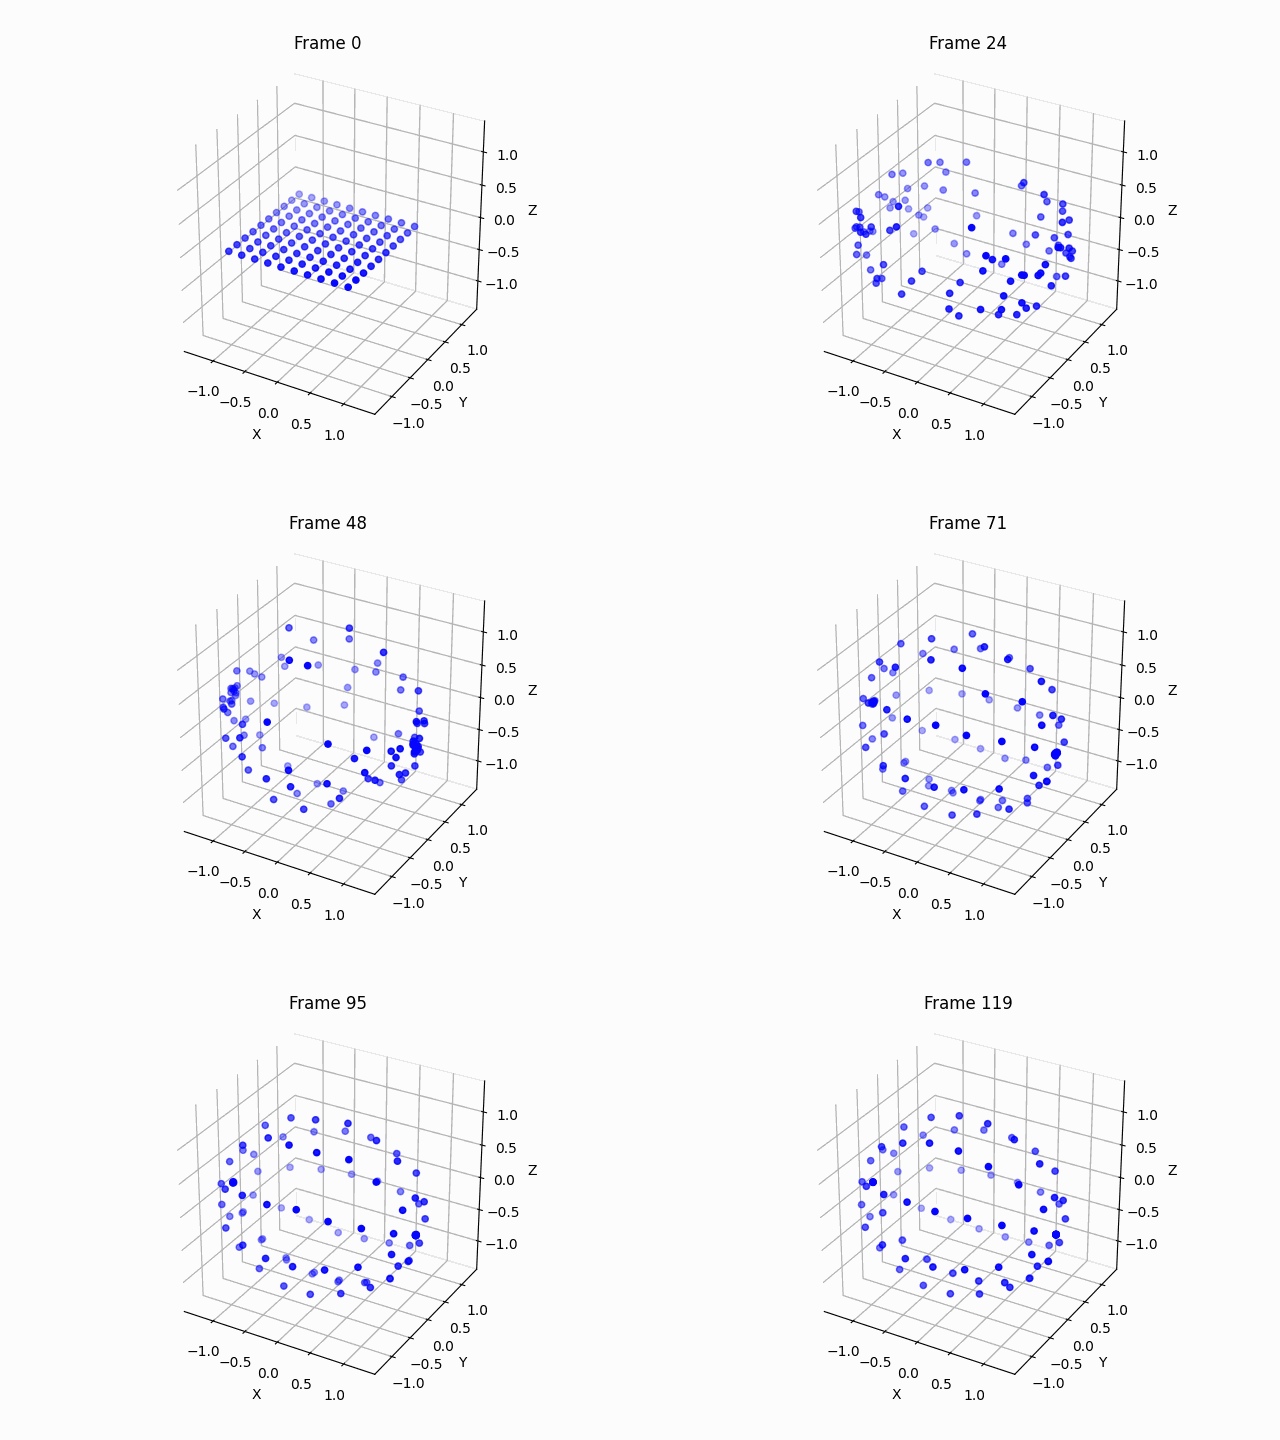
So, we place 10x10 points on the x,y plane (z=0), inside a x,y,z euclidean space. It’s important to set the z to be a small random number, and not exactly 0, in order to break the symmetry and allow the gradient descent to work on the z axis as well. We set the distance between each node to itself to be zero, we set the distances between adjacent nodes to be the distance differential, and we also set the distance between identical nodes on the opposite edges, to be zero, since the $\phi$ angle is cyclic. Here’s the result of the transformation:

So we can see that the points arranges themself to a ball, without any directive from us. We only defined the distance differential, and that’s it. Let’s move the final result around, to see that it is indeed a sphere.
Let’s do some ablations. What happens if set all z to be exactly 0?

You can see that the points arrange themselves as circle, since the z axis optimization is essentially deprecated due to symmetry, thus we must add some small initialization noise, to allow the manifold to bend.
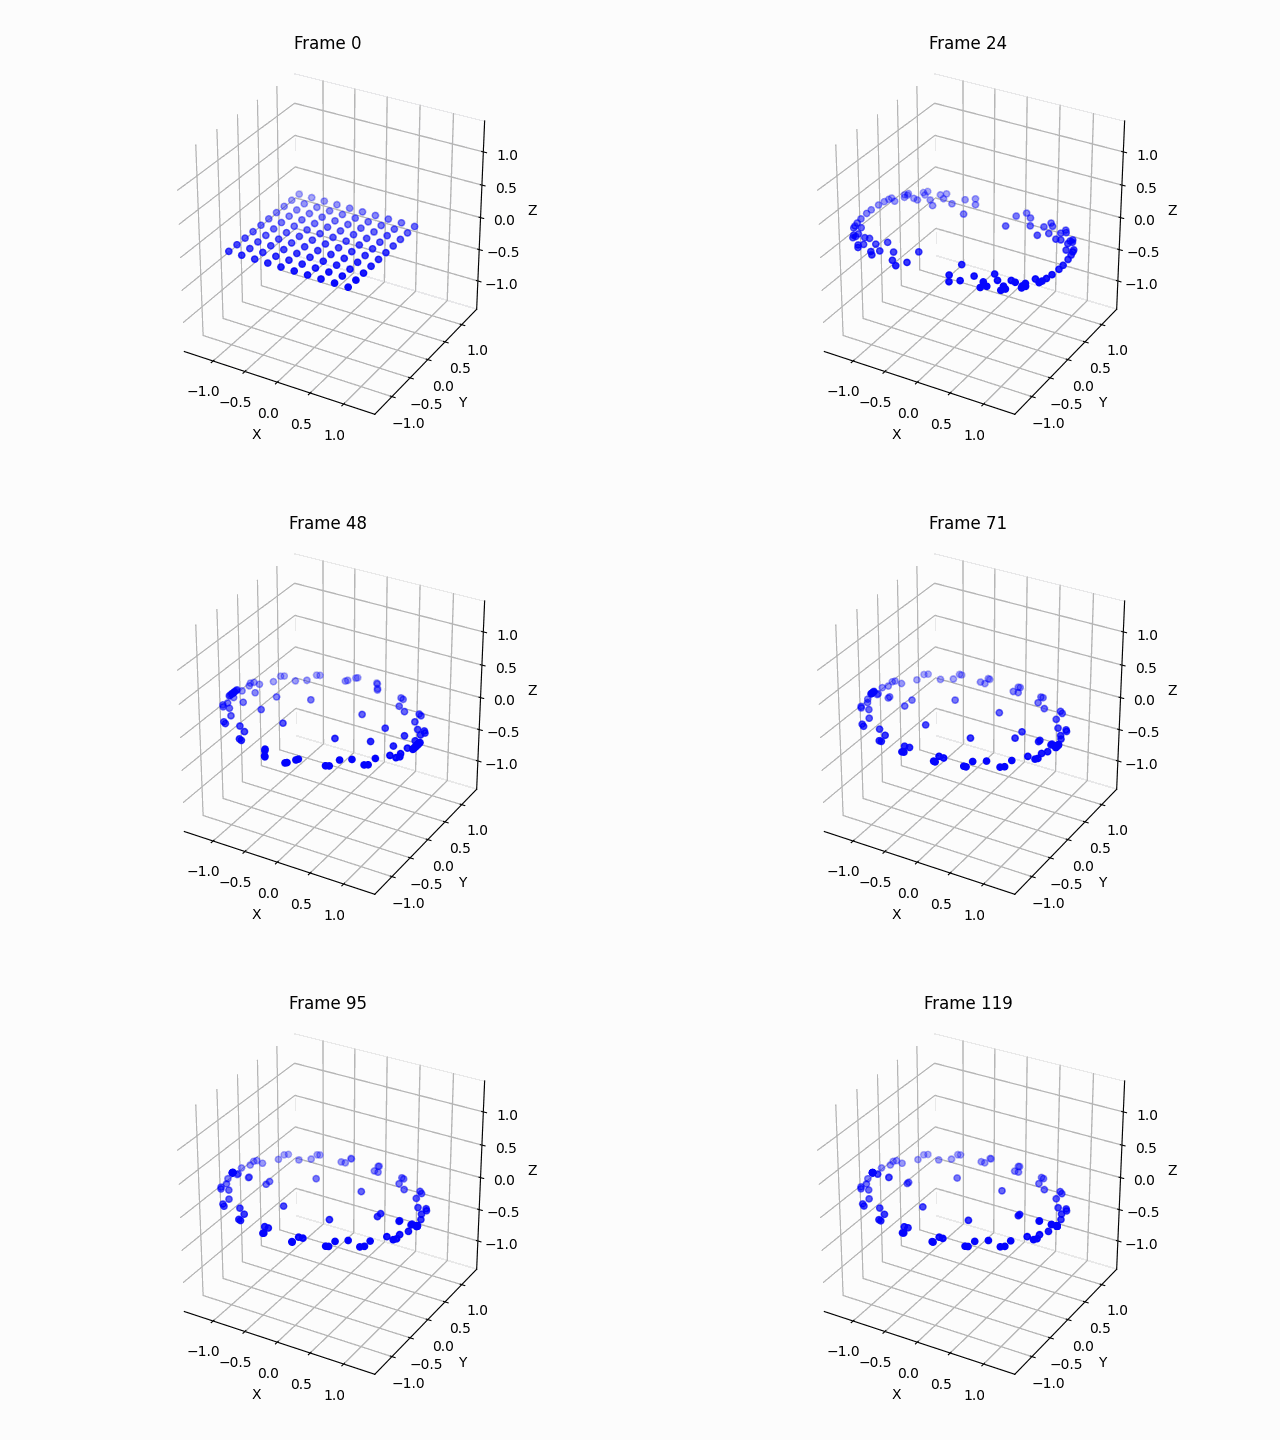
Let’s try something interesting. Let’s remove the setting of identical points, such as $\phi=0,2\pi$, to be with distance 0. So now we don’t tell the graph about the edges, but only the local distance differential.
Interestingly, the points do bend themselves, and start to form a ball, but almost. The ball doesn’t close itself, but it is nice to see that the metric function contains enough power to do the bending by itself.
Hyperbolic Geometry
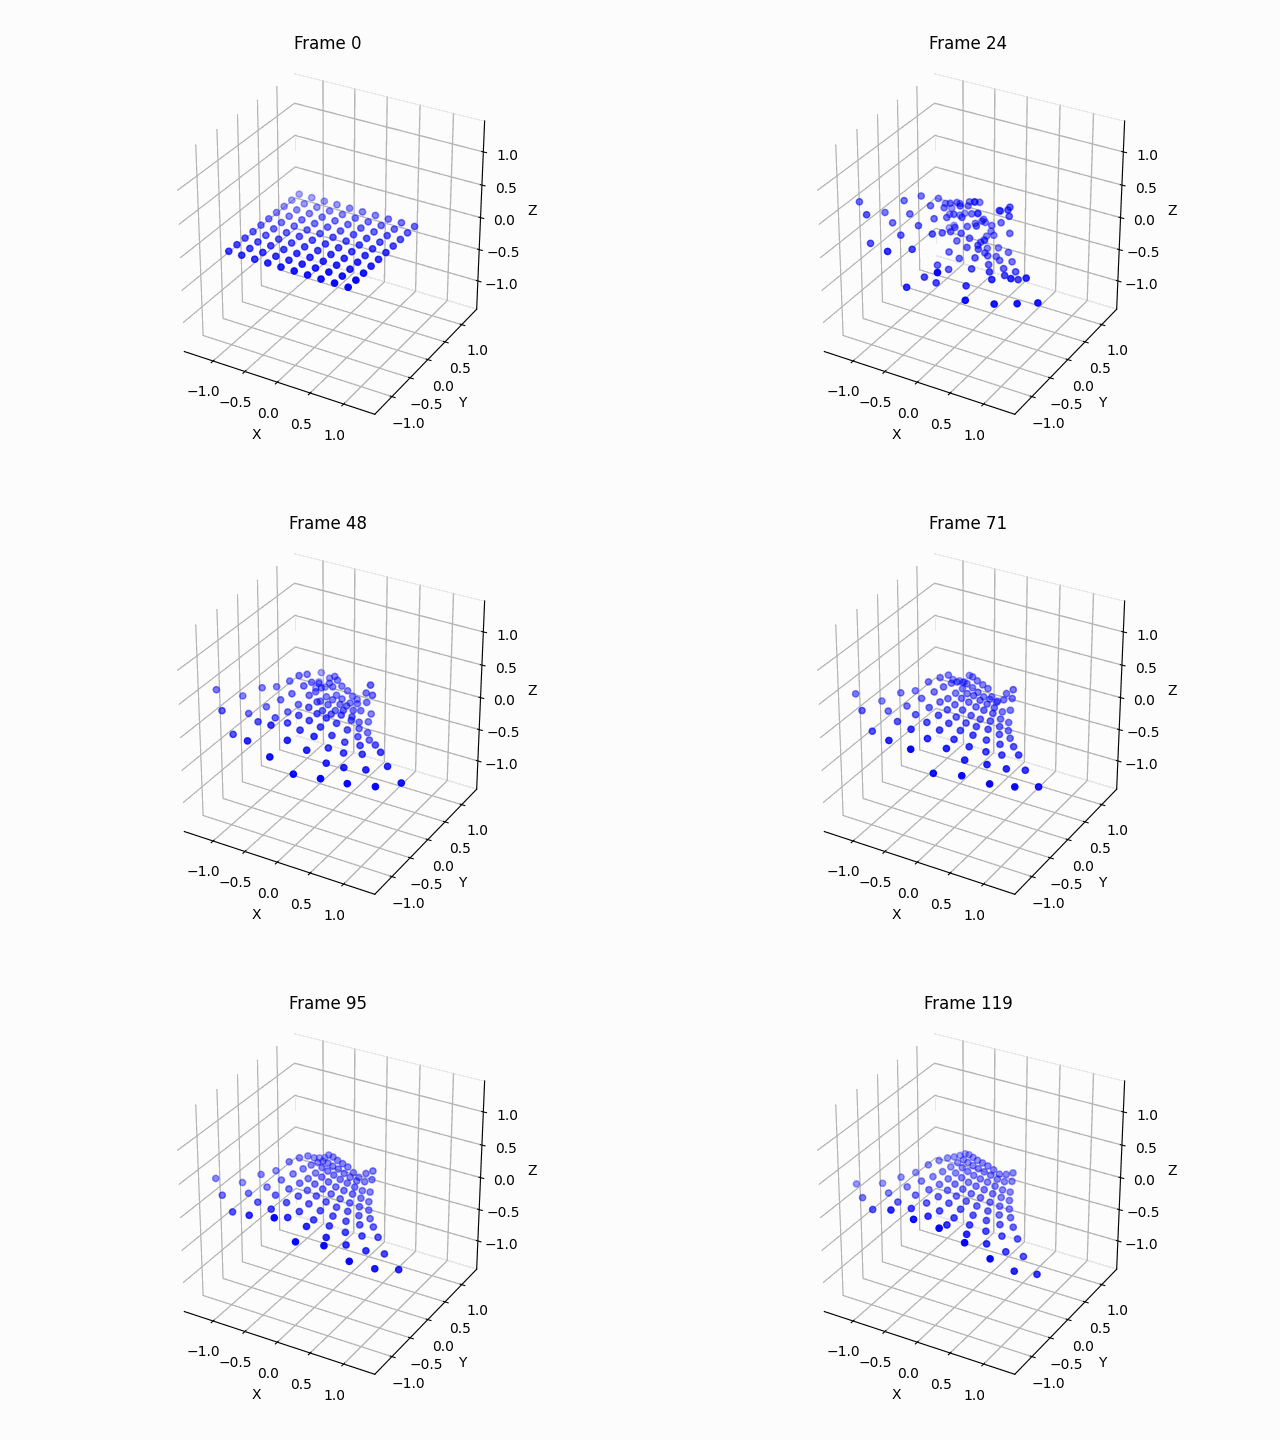
Let’s run the code for hyperbolic geometry, using the Poincaré half-plane model specified above:

Let’s move it around to better see what’s going on:
So we can clearly see the saddle shape, which can help us visualize why there can be more than 1 parallel line through a point to a line, why triangles have sum of angles less than 180 degrees, and more.
$\square$
Conclusion
We presented a method to easily visualize a geometry by specifying only the distance metric, without requiring any additional structure.